This year the annual conference of the Biodiversity Information Standards (historically known as the Taxonomic Databases Working Group — TDWG) is virtual and happening in two parts. The working sessions were concluded a few weeks ago and are separated from the virtual conference, which will be held on October 19-23. All the recordings of the working sessions are now available in youtube.
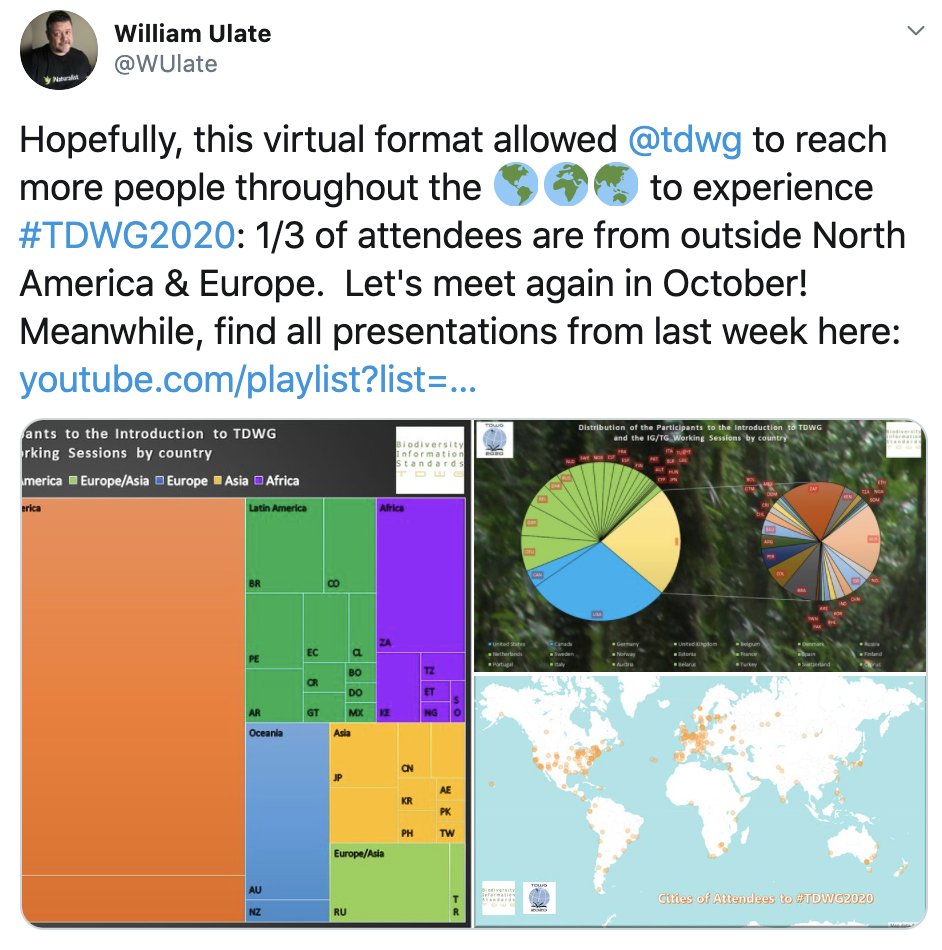
As several people already mentioned in twitter (#TDWG2020) the single track and the virtual format allowed participation from around the world which generated a wide range of discussions on not just data standards but also about data curation, attribution, annotation, integration, publication and most importantly the human efforts that are behind the data and systems.
It is this human aspect in the midst of our current data-intensive approach got me thinking about several contrasting aspects of biodiversity informatics and natural science collections management. Thinking about these two aspects together should be more at the forefront of our data and infrastructure discussions.
One contrast that lurks behind the “data-intensive” approach is the mix of structured collection of items (such as databases, spreadsheets) with narratives. This is what Lev Manovich called in his 1999 article the “database/narrative” opposition:
“As a cultural form, database represents the world as a list of items and it refuses to order the list. In contrast, a narrative creates a cause-and-effect trajectory of seemingly unordered items (events). Therefore, database and narrative are natural enemies. Competing for the same territory of human culture, each claims an exclusive right to make meaning out of the world.”
The physical objects stored and curated by the Natural History Museums and other institutes — elements for scientific meaning-making of the world — provide an interesting opportunity to explore this contrast further. In one hand, we have data collected about specimens and related objects stored in different formats (databases, spreadsheets, etc.). Most often there is some structure to these datasets. For instance this snippet from a GBIF occurrence record:
Branta bernicla nigricans (Lawrence, 1846)
Alaska
North America, United States, Alaska, Aleutians West Census Area
Saint Paul Island, Pribilof Islands
G. Hanna
NMNH Extant Biology
http://n2t.net/ark:/65665/396827066-bc6d-4419-83e7-25774fe2b0d3
With the help of APIs and parsing tools, we can figure out the structure of this snippet and derive at an assessment that this contains species name, collector name, a place, and a specimen identifier. On the other hand, we find snippets like the following hidden among the structured elements. This is from the European Nucleotide Archive (ENA) accession data derived from the above specimen:
DT 02-JUL-2002 (Rel. 72, Created)
DT 29-NOV-2004 (Rel. 81, Last updated, Version 4)
note="obtained from preserved Brant goose (Branta bernicula)
specimen from the Smithsonian Institution's Museum of Natural History;
specimen was originally collected by G.D. Hanna from St. Paul Island,
Pribilof Islands, Alaska, on Sept. 9, 1917
Here we find a narrative — an ordered event list — it describes who, when, and what was collected. Of course, from the linked data, semantic interoperability, machine readability, actionability and FAIR point view, there are plenty of issues here that the community are struggling with. But let’s focus on what it means when our systems and workflows encounter these two very different types of data.
First of all, with tools and APIs, these two datasets (GBIF and ENA) eventually can be linked and made interoperable, FAIR — a definitely useful endeavour. But what is much harder to study and provide is to understand the theoretical underpinning and the context of these data. From several publications related to this specimen (mentioned in the GBIF snippet above), we learn that it was used in research related to the 1918 pandemic virus (the Smithsonian has several thousand such specimens from the early part of the 20th century). As we are living through another pandemic, one might wonder what were the historical, social, and political contexts of collecting and preserving these specimens? Who are the people behind these collection events? (see Bionomia profile of G.D. Hanna).
Scientists and data engineers might not be interested in these questions. Still, we often overlook that there’s no such thing as raw data and contexts, history influence scientific reasoning and the direction of research. This is echoed by different philosophers and historians of science. Most recently by Sabina Leonelli in the context of big data biology where she says, “increasing power of computational algorithms requires a proportional increase in critical thinking”. And as more data-intensive and automated, our research is becoming, the more we need to seriously look at:
“value- and theory-laden history of data objects. It also promotes efforts to document that history within databases, so that future data users can assess the quality of data for themselves and according to their own standards.”
The second point pertains to this aspect of history — in particular when data moves from one system to another. As data are collected from field sites then added to spreadsheets, imported into a database and then published to an aggregator they get denormalized, decontextualized, and then normalized and contextualized again. An API endpoint might provide some provenance information and summary, but the narrative and “data events” usually are missing. And we probably do not expect all systems to capture all these events. But these practices, events, data migrations leave traces of prior use that have impacts on later workflows (see the article by Andrea Thomer et al. that talks about data ghosts that haunt Collection Management System (CMS) data migration).
As we are building and working on data infrastructures to support scientists and eventually the society, we should have a pragmatic and holistic approach in understanding the database/narrative mix. With our unbridled euphoria about all things machine learning, automation and AI, we should be cautious about the long term implications and build something that is here to last.
This brings us back to the human aspect of the data. I will end the article from a quote by historian Mar Hicks. Recently COBOL (designed in 1959) become the scapegoat as the U.S unemployment insurance systems were overwhelmed during the pandemic. It turns out the issue was not with COBOL, it was the web front end that people used to file the claims (written in Java). Her article talks about the notion of “labor of care” — the engineers, people behind COBOL, the care and effort that goes behind maintaining large, complicated software and infrastructures — especially the ones that are needed during a crisis. Our tech innovation culture is too much focused on speed and structure side of things instead of the narrative. I leave you with her concluding sentence:
If we want to care for people in a pandemic, we also have to be willing to pay for the labor of care. This means the nurses and doctors who treat COVID patients; the students and teachers who require smaller, online classes to return to school; and the grocery workers who risk their lives every day. It also means making long-term investments in the engineers who care for the digital infrastructures that care for us in a crisis.
When systems are built to last for decades, we often don’t see the disaster unfolding until the people who cared for those systems have been gone for quite some time. The blessing and the curse of good infrastructure is that when it works, it is invisible: which means that too often, we don’t devote much care to it until it collapses.

Excellent post! Something to be considered, too, is that today’s narratives about collecting events are parts of longer narratives often written long ago by the collectors concerned, or more recently by historians. For this reason I like the idea of connecting the older and newer narratives.
A recent example is in https://doi.org/10.17082/j.2204-1478.61.2018.2018-06 (downloadable PDF). In describing a new millipede my starting information was the locality, date and collector on the Australian Museum label. But collector Anthony Musgrave had written an illustrated account of his field trip for the “Australian Museum Magazine” in 1928. The account allowed me to reduce the collecting site from most of a mountain range to the close surrounds of a small private property block. A digital version of the magazine is online and I cited a link to it.
An even better example is the wonderful scholarship of Åsa Ferrier (https://www.researchgate.net/profile/Asa_Ferrier), who has researched and published about the Australian expeditions of Eric Mjöberg more than 100 years ago. Using Mjöberg’s publications and his diaries, Ferrier has been able to reconstruct the expeditions, which were extraordinarily productive of ethnographic and zoological specimens, and which tie in closely with Aboriginal land use in tropical Queensland. The landscape has since changed dramatically, but Mjöberg’s writings and diaries provide documentation of the environments he visited and the cultural prejudices he brought with him from Europe.
LikeLiked by 1 person
Hi Robert, thanks for your comment.
Yes, totally agree on the importance of the longer narrative which is harder to capture in a structured format. And thanks for the link to the papers, found it useful. I also found your data cleaning examples in your blog (https://www.datafix.com.au/BASHing/) useful.
Another way people are addressing the longer narrative is through visualizations. Check out this project done by Yanni Loukissas (https://loukissas.lmc.gatech.edu/uncategorized/life-and-death-of-data/) who looked at Arnold Arboretum’s accession records and through the visualization you can see interesting patterns that point to specific moments in history.
LikeLike